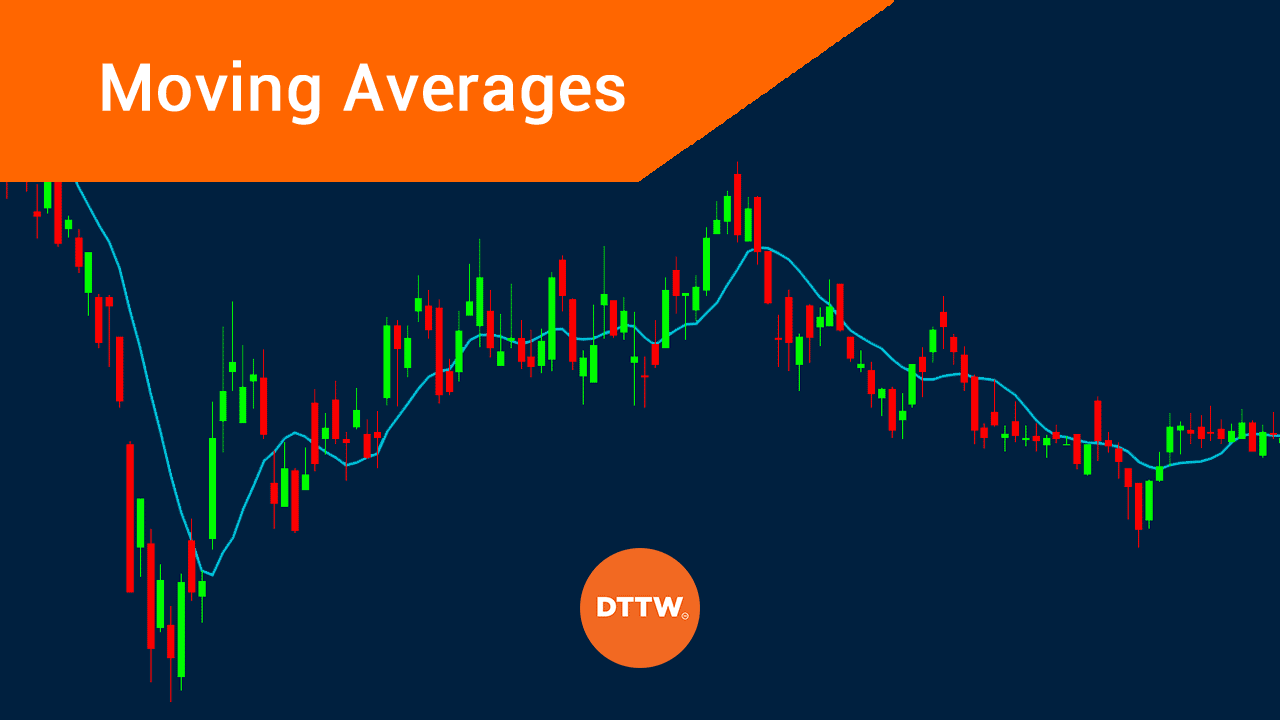
Moving averages are one of the most widely used tools in trading and for a good reason. These simple yet powerful indicators can help traders identify trends, predict price movements, and make more informed trading decisions.
What is a moving average in trading, and how do you use it effectively in your trading? This article will explore the hidden secrets of moving averages and examine some critical strategies for leveraging them to improve your trading results.
What are moving averages?
The first thing to understand about moving averages is past price data, which means that they tend to lag behind current market conditions, which can be both a strength and a weakness. On the one hand, this lag allows you to identify trends that may continue in the future, but on the other hand, it also means that you may miss out on some short-term market movements.
The most popular and common type of moving average is the simple moving average (SMA), and this is calculated by taking the average of a given set of prices over a specific period. For example, if we take the closing price of the past ten days, our SMA would be the sum of those prices divided by 10.
While SMAs are the most commonly used moving averages, several different types can be used for different purposes. Some of the more popular variants include Exponential Moving Averages (EMAs), Weighted Moving Averages (WMAs), and HullMoving Averages (HMAs).
How to use moving averages in trading
Now that we know more about what moving averages are and how they are calculated, let’s use them effectively in your trading.
One of the most common ways in the UK to use moving averages is to identify trends. As we mentioned earlier, moving averages tend to lag behind current market conditions, so traders can use them to identify upward and downward trends.
If the market is in an uptrend, the price will typically be above the moving average. Conversely, if the market is in a downtrend, the price will usually be below the moving average.
Another way to effectively use moving averages is to predict future price movements, which traders can do by using support and resistance levels. If the market seems to be moving sideways and is stuck between the moving average and support and resistance level, it may indicate no clear direction in the market.
In addition to identifying trends and predicting price movements, traders can also use moving averages to make more informed trading decisions. For example, some traders will use moving averages as entry signals, waiting for the price to break above or below a specific moving average before entering a trade. Other traders might use them as exit signals, closing positions when they cross over another moving average in the opposite direction.
What are the benefits of using moving averages?
One of the main advantages is that they can help to simplify your analysis and make it easier to identify market trends as they can be used as both entry and exit signals.
Additionally, moving averages tend to lag slightly behind current market conditions, which means they can provide a measure of protection against making emotionally-driven decisions.
What are the risks of using moving averages?
While moving averages can be a powerful tool for traders, it’s essential to understand the risks involved. Because moving averages are based on past price data, they will not always give you an accurate and up-to-date representation of what is happening in the market right now.
In addition, some traders may misuse moving averages and compound their losses by trading against the trend or entering trades too soon.
The bottom line
Ultimately, how you choose to use moving averages will depend on your trading style and preferences. Novice traders should use a reliable and experienced online broker such as Saxo Bank which has a dedicated platform of trading tools to practise making trades with the use of moving averages in chart analysis.
